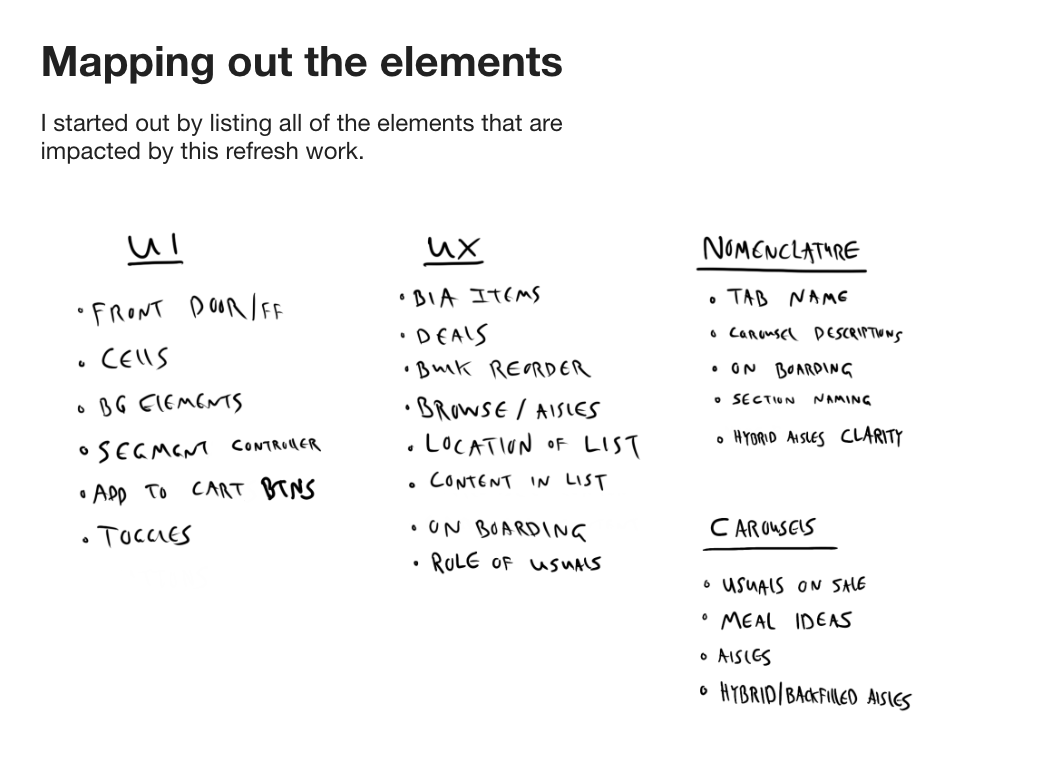
Case Study 04

Reinventing digital grocery shopping

Led the design of Target's digital grocery experience across three connected initiatives — from a new shopping tab to personalized reordering to a full design refresh — generating $244M+/month in revenue.

Role
Lead Product Designer
Company
Target Digital
Duration
2020 – 2023
Full flow of the redesigned Target digital grocery experience showing tab navigation, personalized carousels, and fulfillment selection

Grocery lived inside a list-making tool

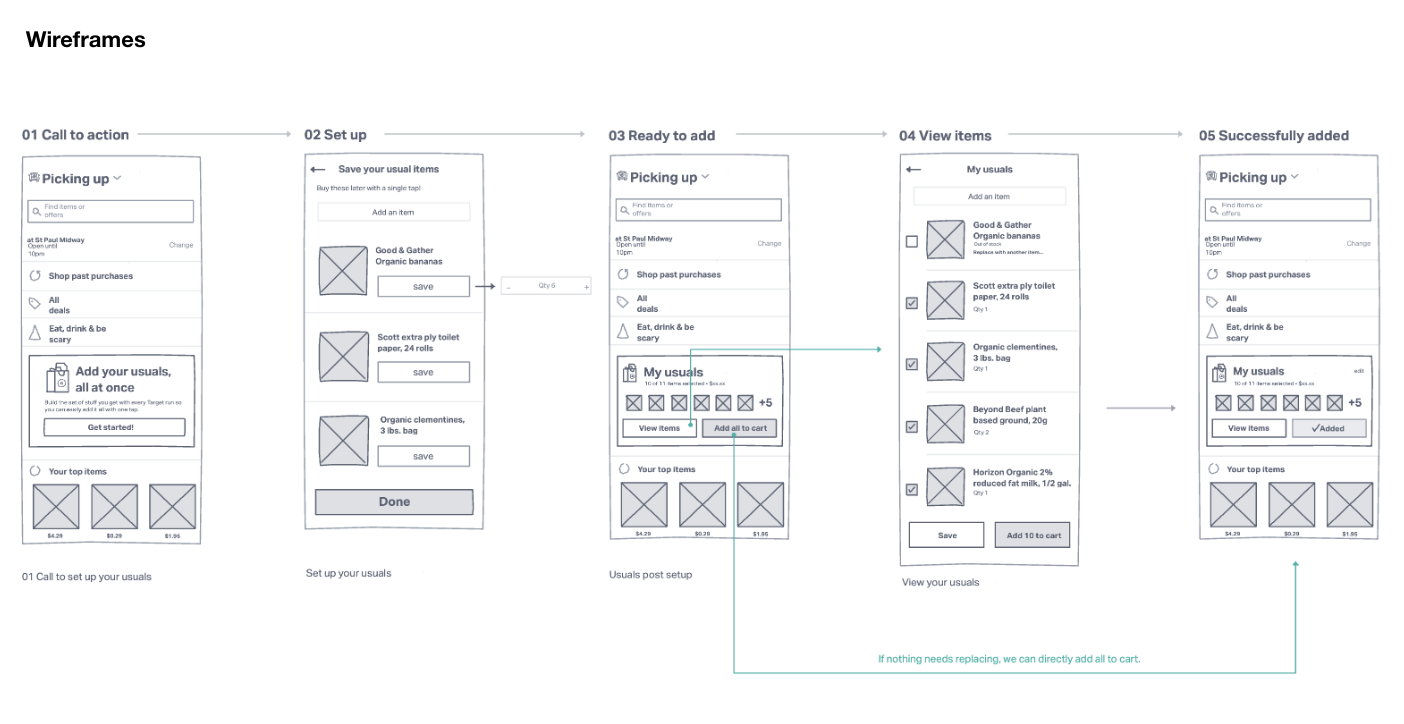
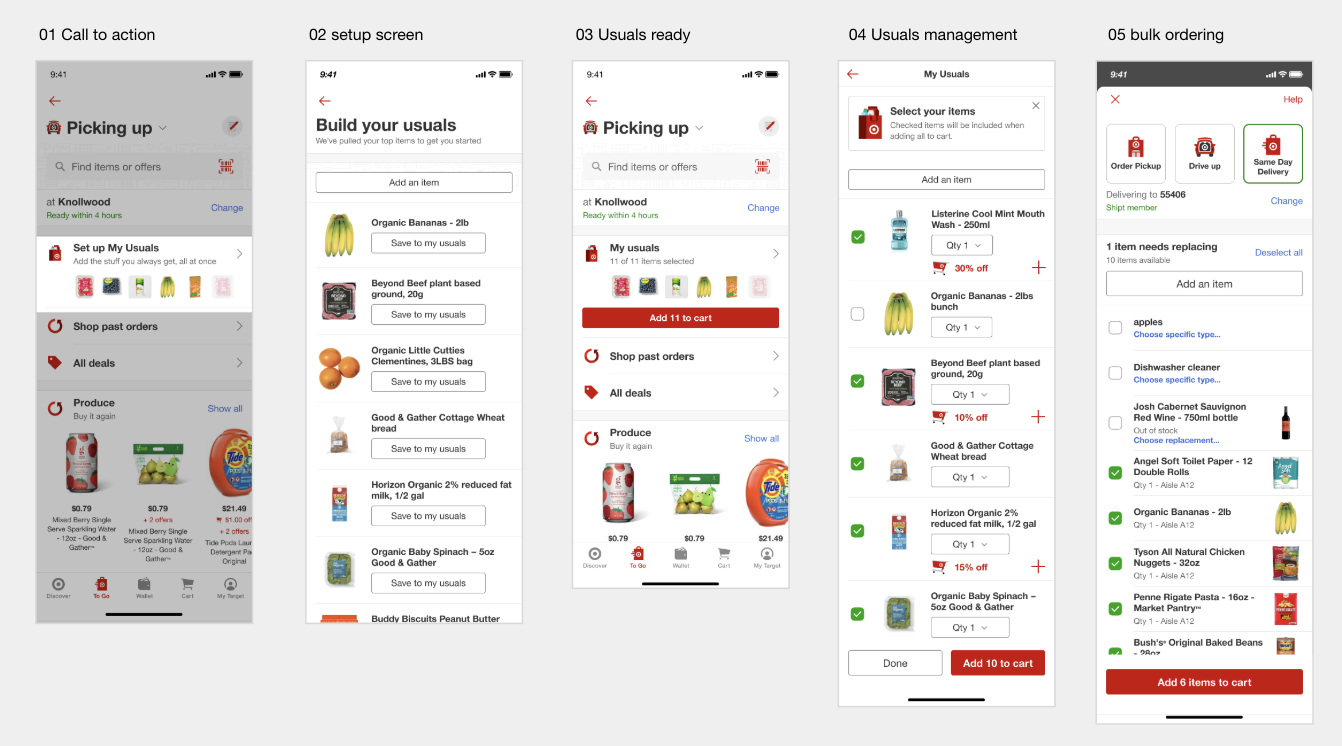
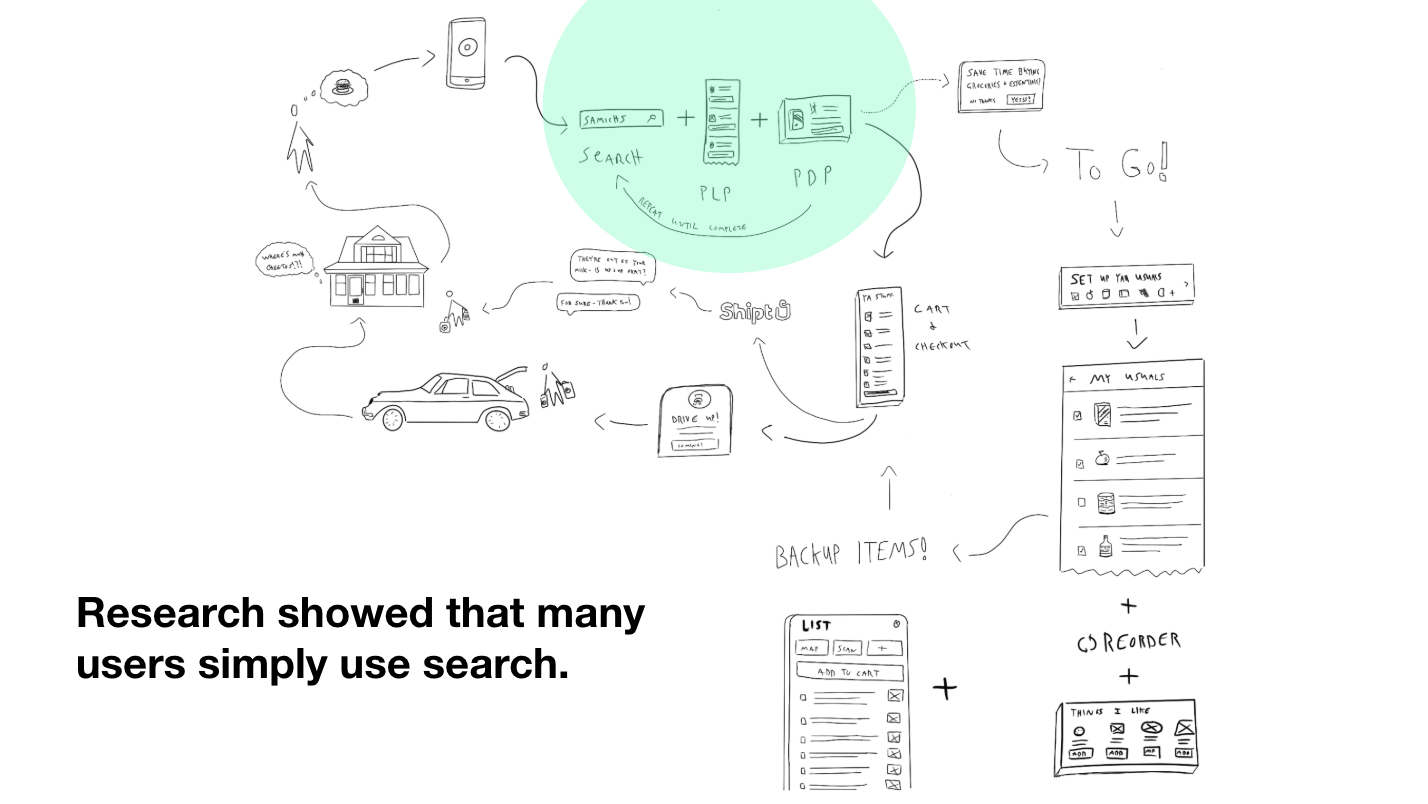
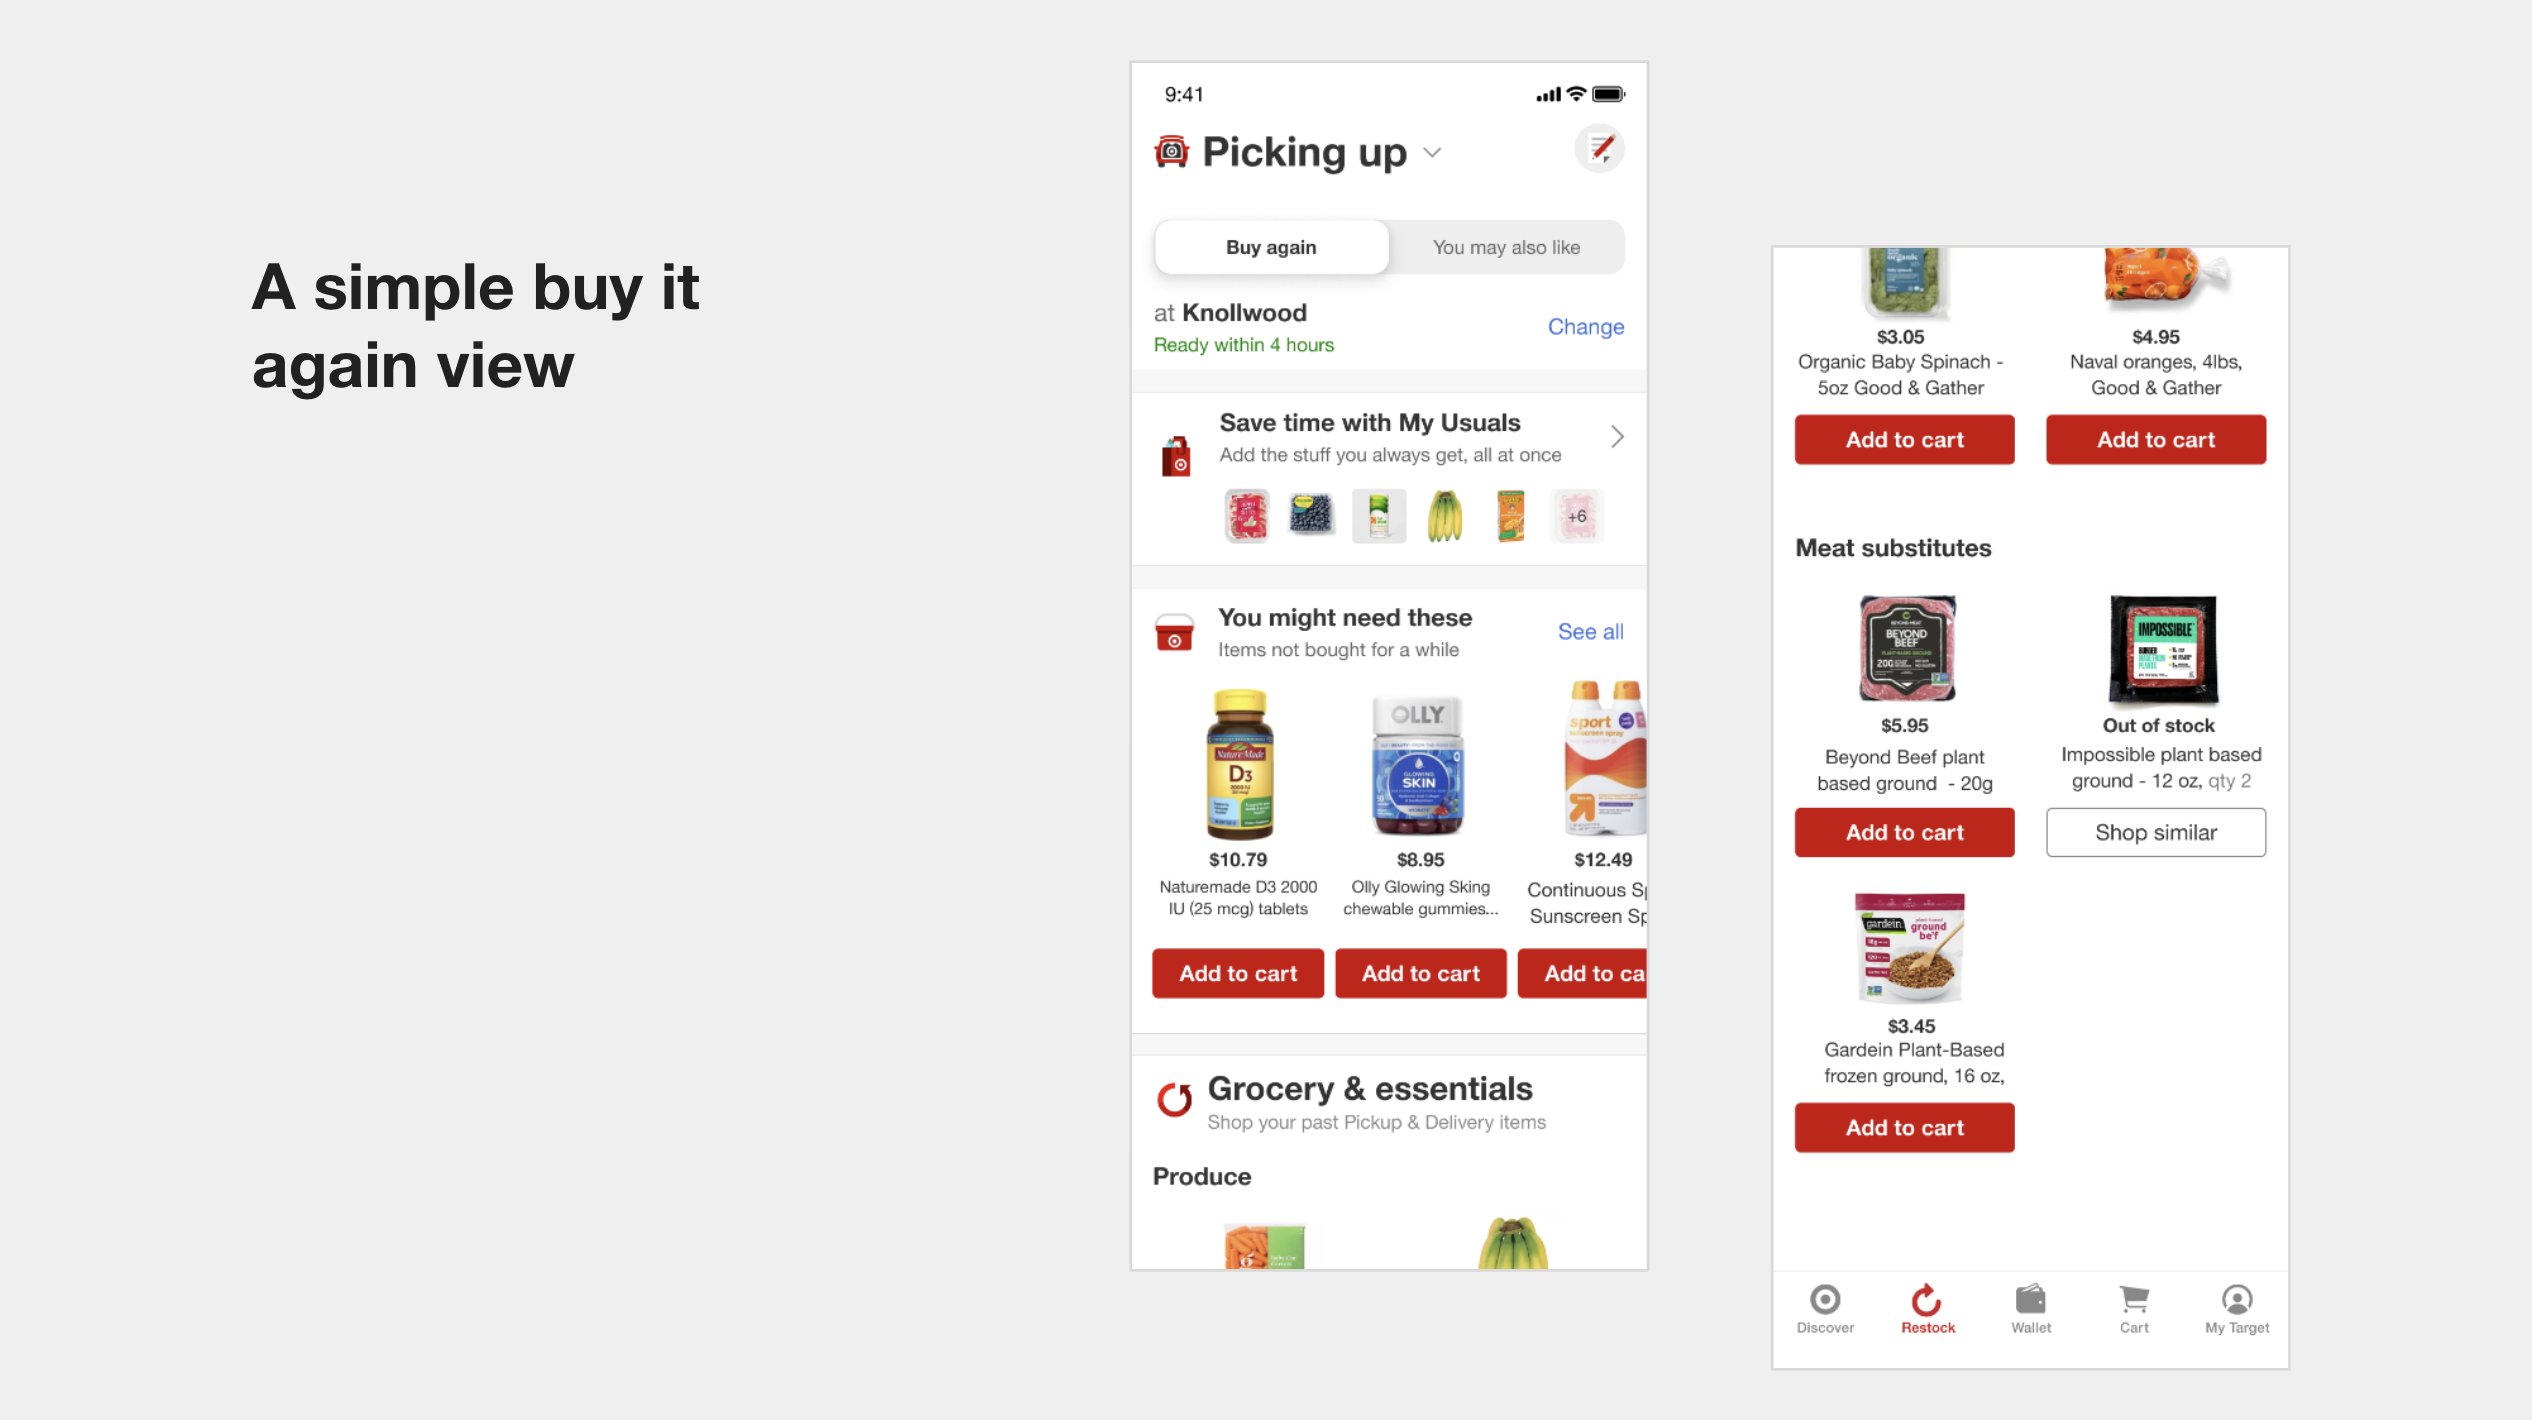
When I joined Target's basket-building squad in January 2020, digital grocery was buried inside a confusing list-making interface. Users had to work hard to find modern fulfillment services like Pickup and Delivery, and there was no cold storage for pickup orders — meaning fresh and frozen items couldn't be sold through the fastest fulfillment channel.

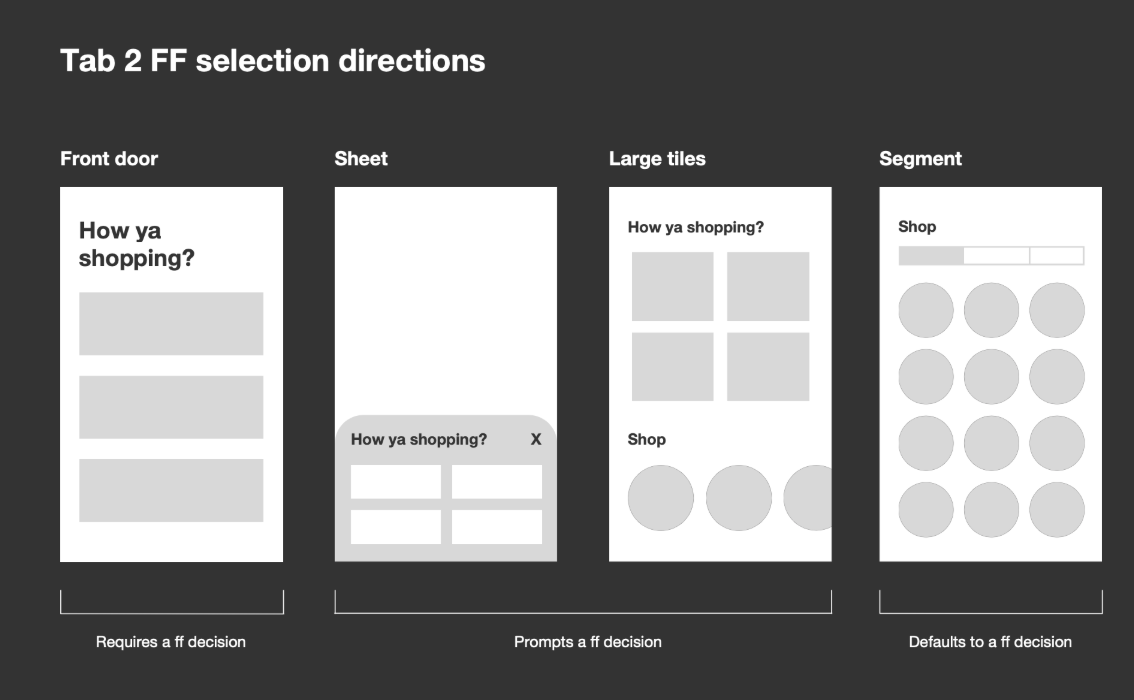
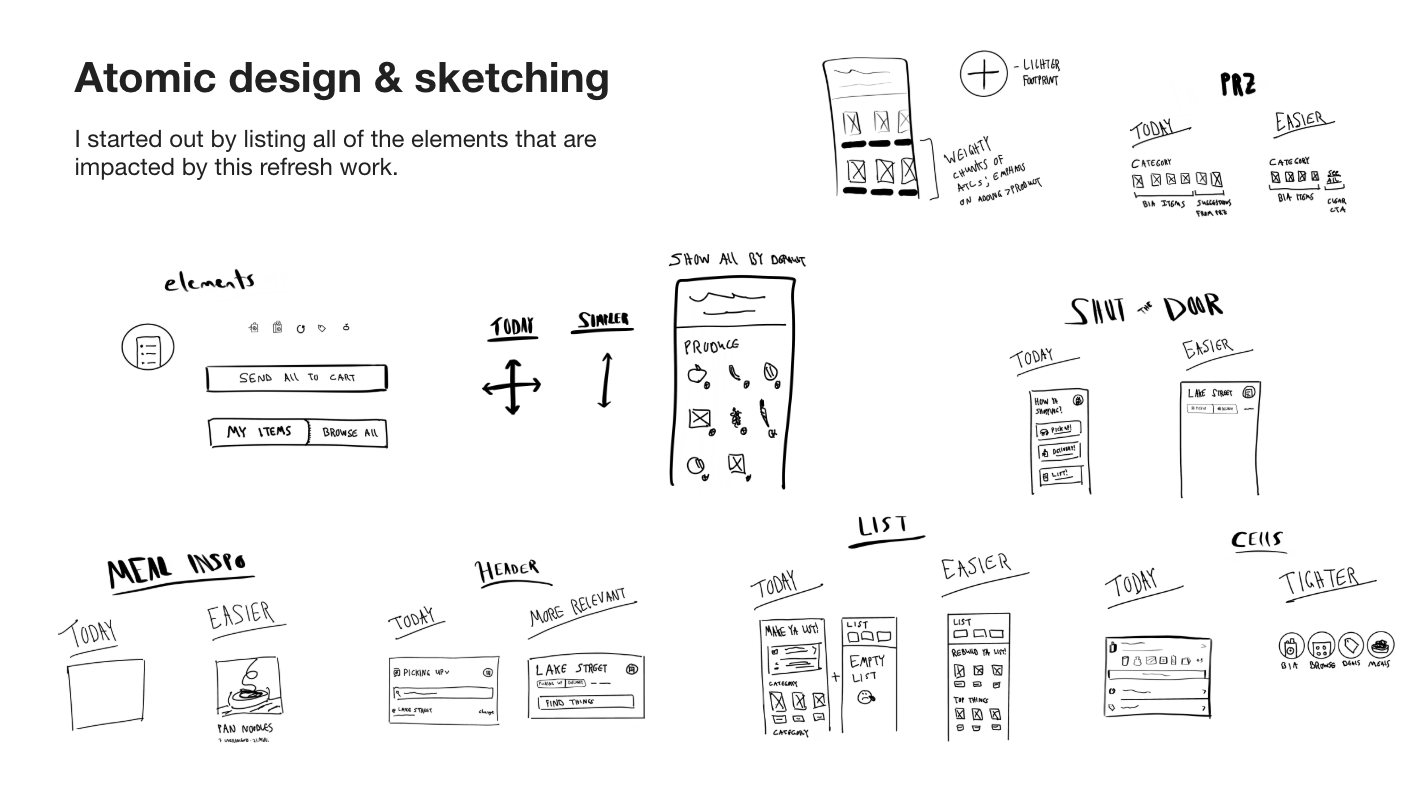
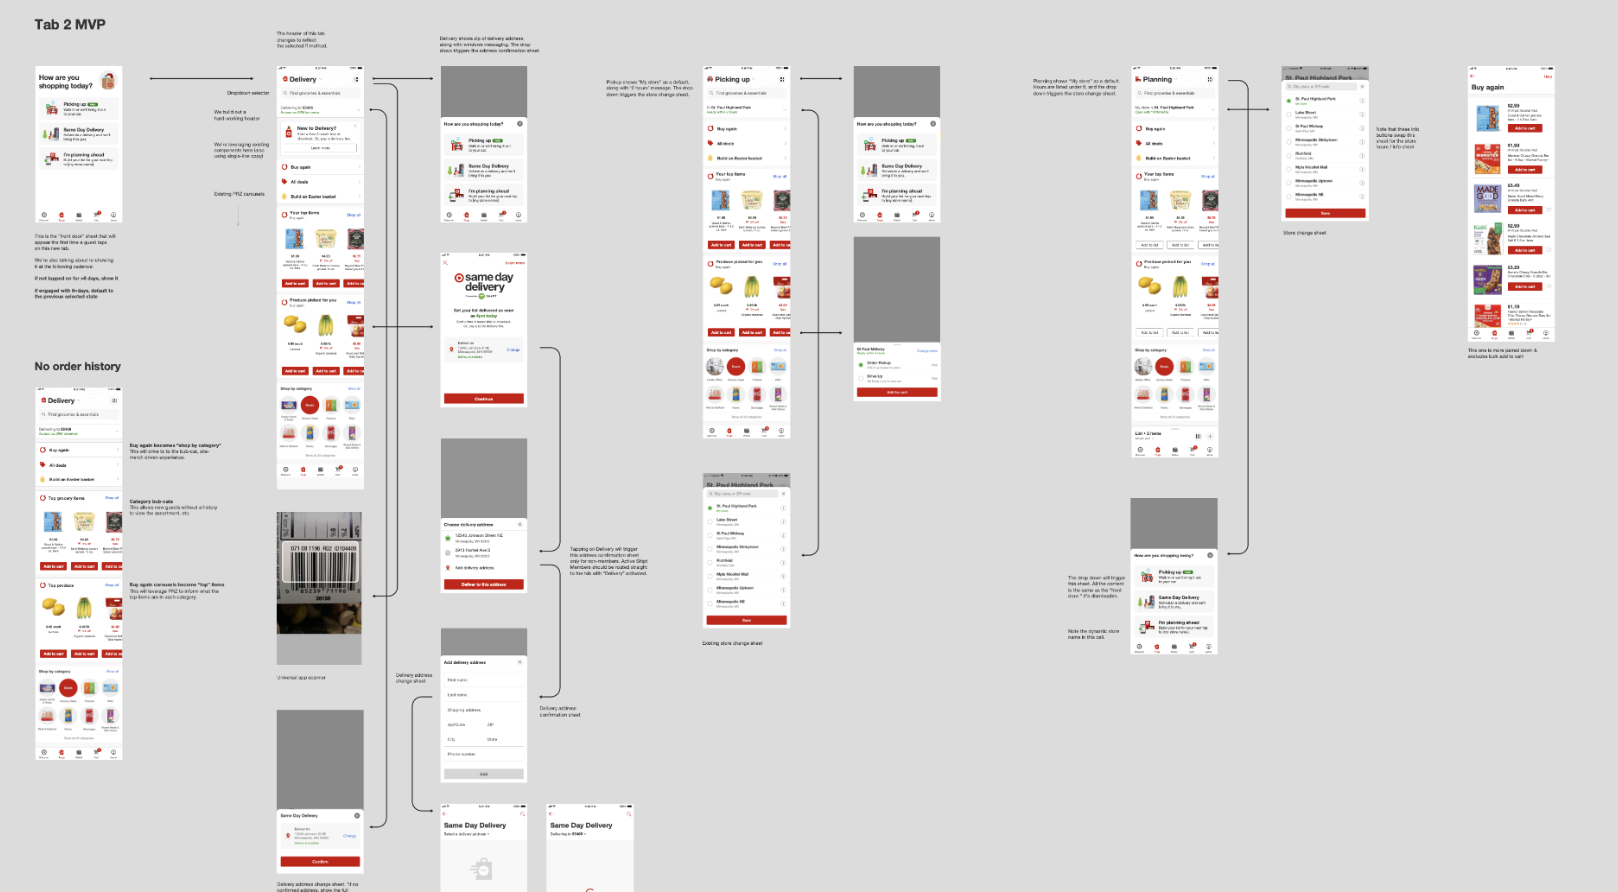
My hypothesis was that shopping for frequency items using Pickup and Delivery should be easy, personalized, and elevated within the app — not hidden behind a legacy tool. I created a vision for a dedicated grocery tab focused entirely on fulfillment-first shopping. Leadership was skeptical; they'd invested years in the existing experience. Then March 2020 happened, and everything changed overnight.

Four wireframe approaches for fulfillment selection: front door, sheet, large tiles, and segment
Four directions for the fulfillment selection pattern — from a full-screen "front door" to a segment control that defaults to a shopping mode. Each tested a different level of commitment from the user.

A clear question before anything else

I led multiple design charrettes to break through skepticism and build alignment across teams. The key insight was simple: start by asking users how they want to shop. "How are you shopping today?" became the front door — Picking Up, Same Day Delivery, or Making a List. Once a user chooses, every item shown is available and eligible for that fulfillment method. No guessing, no disappointment at checkout.

I partnered with the personalization team to create an algorithm that prioritized items by repurchase likelihood. Categories (carousels) are sorted by what you're most likely to buy again, and items within each carousel follow the same logic. The result is contextual discovery — familiar buy-again items blended with personalized recommendations, all within a fulfillment method the user has already committed to.

Simple fulfillment navigation — the shop view alongside the fulfillment selection sheet showing Picking up, Same Day Delivery, and Making a List
The fulfillment-first approach in action: the shop view with personalized carousels, alongside the bottom sheet that lets users switch methods at any point without losing their cart.
Personalized carousels showing all available and eligible items alongside easy weeknight meal combo collections
Every item shown is available and eligible for your chosen fulfillment method. Easy combo collections simplify meal planning for busy families.
Start by asking how someone wants to shop — then make every item on the page available that way.

An instant platform for growth

$244M+
Monthly revenue through the tab
23%
Of all app orders placed through the tab
$2.9B+
Annualized revenue from projects led

The tab launched in June 2020 and gained millions of users immediately. It became the foundational platform for all digital grocery features — every subsequent initiative, including My Usuals and the design refresh, was built on top of this experience.

Usage has been relentlessly growing since launch. The fulfillment-first approach meant users weren't just browsing — they were shopping with intent, leading to higher conversion and larger baskets than any previous grocery entry point in the app.

Part 2

My Usuals

Target had tried item subscriptions and it failed. Users kept canceling because the cadence was never right. I took the initial motivation — not wanting to forget your staples — and solved it fresh.

A one-tap reorder list that learns from you

I ran moderated interviews to understand why users started and later cancelled subscriptions — the pattern was always the same: subscribe, find the cadence imperfect, see the same items on sale in-store, cancel. The insight: "usual" items should be easily accessible within the context of all your buy-again items, not locked into a rigid delivery schedule.

I wrote a pitch (inspired by Shape Up), started sketching, and focused on simplicity. The core flow: a personalized call-to-action within the To Go tab surfaces thumbnail previews of your most-purchased items. Tapping "Set up My Usuals" opens an algorithmic starter list — items pre-selected based on purchase frequency and preference. Users refine from there, and adding everything to cart is a single tap.

Early sketches
Hand-drawn sketches of My Usuals concept — compact widget with thumbnail previews, expandable detail view
Initial pen-and-paper sketches exploring the widget format — a compact preview that expands into a full management view.
Wireframe flow
Five-step wireframe flow: call to action, setup, ready to add, view items, successfully added
The five-step flow: discover the CTA, build your list from an algorithmic starter set, review, add all to cart, done. Click to zoom.
Complete My Usuals flow — five screens from call to action through setup, usuals ready, management, and bulk ordering
The complete My Usuals experience: from the in-tab call to action, through setup and curation, to one-tap bulk ordering.

Highest average order value in the app

125K
Monthly orders, exceeding 114K goal
$81.60
AOV — highest ever, vs. $57.60 app average
0
Promotional spend at launch

My Usuals exceeded its monthly order goal with zero promotional effort — users found it organically through the To Go tab. The average order value of $81.60 was the highest in the app, far exceeding both the app average of $57.60 and the previous List AOV goal of $62.15.

The feature proved the hypothesis: when you make it easy for people to reorder their staples with a single tap, they build bigger baskets. Users weren't subscribing to a cadence — they were shopping on their own terms, which turned out to be far more effective.

Part 3

Design refresh

After the tab and My Usuals were live long enough to generate meaningful data, the story was clear: ~93% of revenue came from the simplest carousels. Users wanted to buy the same things easily — everything else was noise.

Data pointed toward radical simplicity

I assembled all research and analytics around the experience. Roughly 93% of revenue came from the simplest buy-again carousels, while only about 7% came from features like My Usuals and recommendations. I led a dedicated research effort with moderated sessions, rank-order exercises, and open-ended feedback. The rank-order data confirmed it: "buying the same things easily" scored all 5s. Discovering new items ranked lowest.

This gave us a clear framework for what to invest in and what to let go of — and the confidence to make big structural moves rather than incremental tweaks.

User journey mapping
Sketched user journey showing how users navigate to the grocery tab — most simply use search
Research showed that many users simply use search — they weren't even discovering the tab's curated experience.
Design charrettes
Working session with sticky notes — design charrettes co-led with skeptical Discover tab partners
I co-led focused design charrettes with Discover tab partners, turning skepticism into shared ownership.

Focused on what users care about, let go of everything else

I distilled the research into six prioritized user problems, each backed by data and a specific hypothesis. The biggest: many users didn't even know the tab existed. Second: confusion between Usuals, buy-again, and recommendations. I mapped each problem to a concrete UI solution — every design decision traced directly back to a validated user need.

The approach was atomic: I started by listing every element the refresh would touch, sketched individual components, then assembled them into full layouts through iterative rounds of collaboration and testing. The final design introduced clearer naming, "You might need these" reminders for items not bought recently, out-of-stock substitutes, and a dedicated personalized discovery section.

Mapping elements
Handwritten inventory of every UI element impacted by the refresh
Every element the refresh would touch — from front door to carousels to toggles — listed across current and proposed states.
Atomic design & sketching
Atomic design sketches — individual components like search bars, toggles, cards, and navigation elements
Sketch individual components first, then compose them into screens. Every element had to earn its place.
Assembling the puzzle — dozens of hand-drawn wireframe iterations showing how components come together into full screen layouts
Dozens of iterations exploring how atomic components compose into full screen layouts — variations of navigation, content hierarchy, and reorder flows.
Annotated UI showing how each design element maps back to a specific user problem identified in research
Every element in the final design maps directly to a prioritized user problem. Research guided the decisions — not assumptions, not stakeholder preferences.
The refreshed experience
Two views of the refreshed experience — a simple buy-it-again view alongside personalized discovery with smart recommendations
The two core modes: a simple buy-it-again view highlighting products guests buy most often, alongside personalized discovery with smart recommendations based on purchase history.
93% of revenue came from the simplest experience. Focus on what users care about — let go of everything else.

Targeting $6B annually

50%
Target: app orders through the tab (up from 23%)
$500M
Monthly revenue goal (~$6B/year)
6
Prioritized user problems addressed

The design refresh was built as an A/B test against the existing experience, with a multivariate test for naming and iconography. The goal was ambitious: double the tab's share of app orders from 23% to 50%, and push monthly revenue from $244M to $500M — roughly $6B annually.

Every design decision in the refresh was traceable to a specific user problem validated through research. This wasn't a visual polish — it was a structural reorganization driven by data, built on the platform established by the original tab launch two years earlier.

Next Project